Sample finance dashboards and automation workflows built with dummy data to demonstrate project profitability analysis, cost control, MIS reporting, and finance process improvement.
These examples are created for portfolio demonstration only and do not contain confidential employer or client data.
Project Profitability Dashboard
A Power BI dashboard concept designed to track project revenue, cost, margin, variance, and profitability movement across multiple projects.
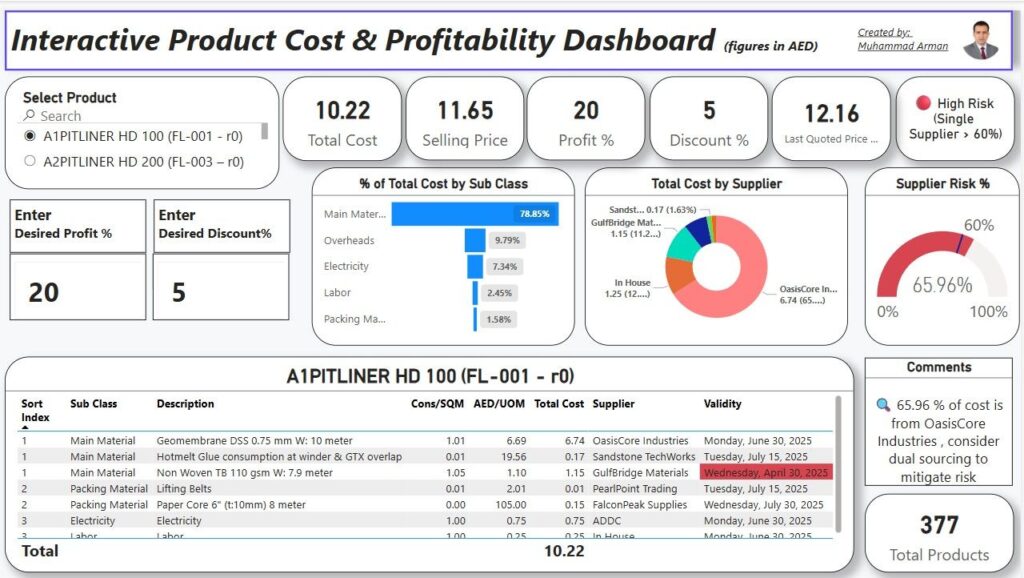
Sample product cost and profitability dashboard created with dummy data.
Focus areas:
- Project-wise revenue and cost visibility
- Gross margin movement
- Top profitable and loss-making projects
- Revenue and cost variance analysis
- Management-level summary view
Cost Control / EVM Dashboard
A cost control dashboard concept designed for project-based businesses to monitor planned value, earned value, actual cost, CPI, SPI, and cost overrun indicators.
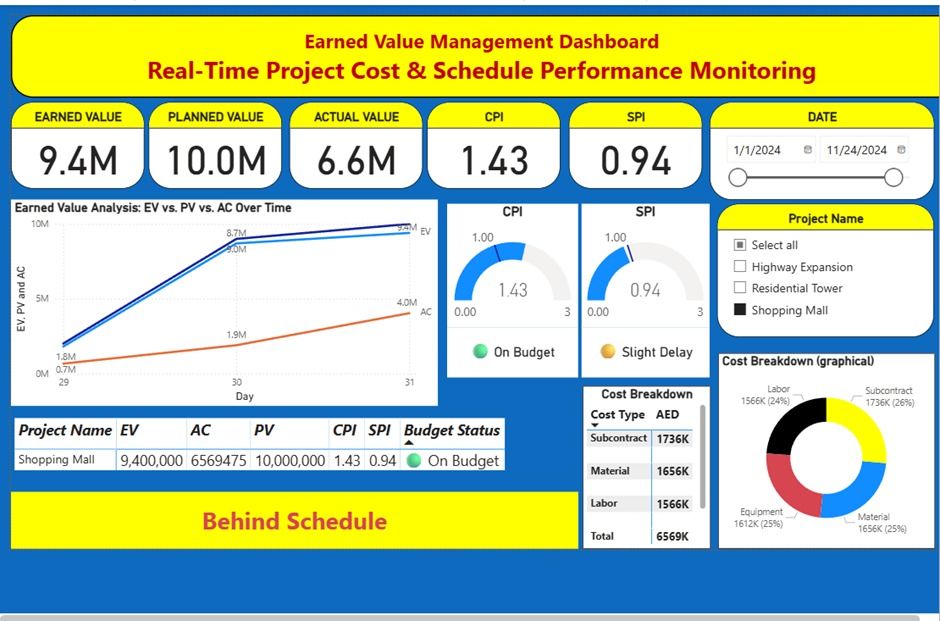
Sample EVM and project cost control dashboard created with dummy data.
Focus areas:
- Budget versus actual cost tracking
- CPI and SPI performance indicators
- Cost overrun visibility
- Material, labor, subcontractor, and equipment cost review
- Early warning indicators for management
MIS Automation Workflow
A monthly reporting workflow concept designed to convert manual Excel files and ERP exports into structured management reports with faster review, fewer manual errors, and clearer reporting controls.
ERP Export / Excel Files → Data Cleanup → Power Query / Power BI Model → MIS Dashboard → Management Summary
This workflow shows how manual monthly reporting can be converted into a structured MIS process where ERP exports and Excel files are cleaned, transformed, and converted into dashboards and management summaries.
Focus areas:
- Excel and ERP export cleanup
- Monthly MIS report structure
- Automated data transformation workflow
- Management summary and variance commentary
- Reduced manual preparation time