Finance intelligence, automation and decision support systems built with synthetic data to demonstrate how finance can move beyond historical reporting into earlier diagnosis, stronger controls and management action.
These examples cover project profitability, early warning analytics, cost control, MIS automation and finance process improvement. No employer, client or commercially confidential information is used.
CFO Radar — Project Performance Intelligence
Turning fragmented project data into early financial warnings, quantified exposure and management action.
CFO Radar is a management decision-support system designed to help CFOs and business leaders identify where profit is deteriorating, where cash is being absorbed, what commercial or delivery risks could affect the forecast next, and who needs to act.
Rather than stopping at historical variance reporting, the system connects project financial and operational indicators to answer five management questions:
- What changed?
- Why did it change?
- What is the AED financial consequence?
- What could happen if management does nothing?
- Who owns the next action?
Management value: CFO Radar helps move project reporting from rear-view MIS into forward-looking intervention, supporting earlier action on margin, cash, commercial exposure and delivery risk.
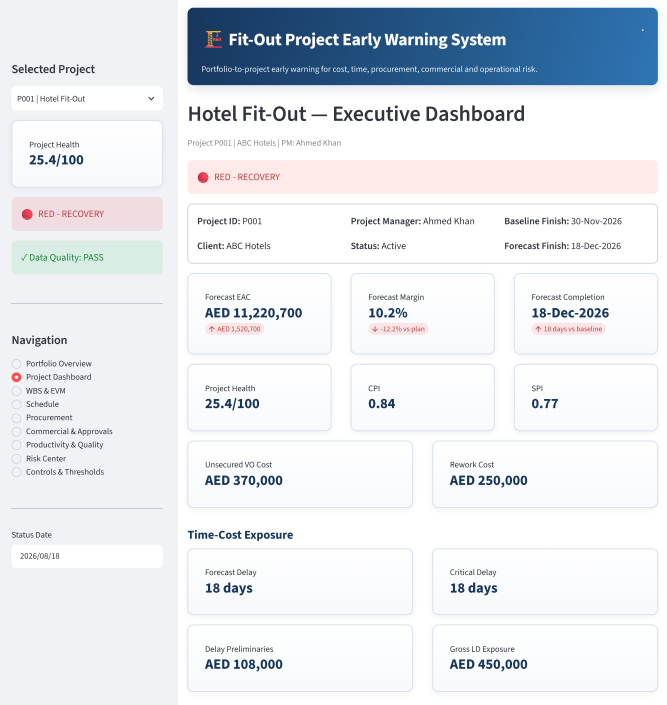
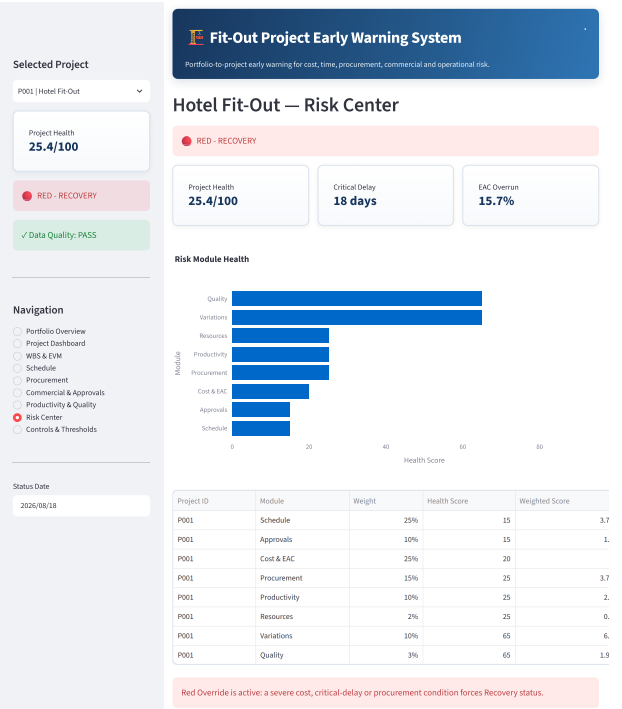
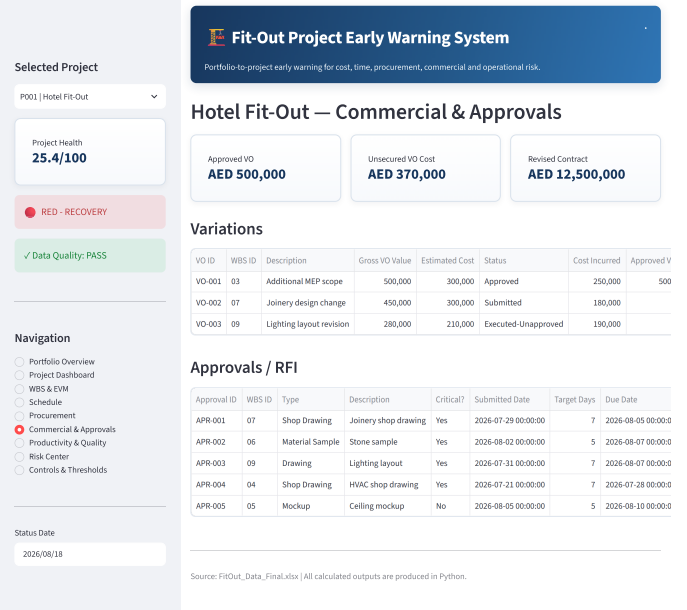
Fit-Out Project Early Warning System
Turning project data into early management warnings before cost, schedule and margin deterioration become financial surprises.
This management-focused system brings project financial and operational indicators together to identify emerging risks across fit-out projects. Rather than simply reporting historical performance, it is designed to highlight which project needs attention, why performance is deteriorating, and where management should investigate first.
What It Does
- Monitors budget, actual cost and project progress
- Tracks CPI, SPI, cost variance and schedule variance
- Forecasts Estimate at Completion (EAC) and Estimate to Complete (ETC)
- Highlights forecast margin deterioration
- Generates project health scores and risk indicators
- Identifies projects requiring management intervention
- Supports project-by-project drill-down and trend analysis
Management value: Earlier visibility of project deterioration enables finance and operations teams to investigate cost overruns, productivity issues, schedule slippage and forecast-margin risk before they become major financial problems.
Portfolio demonstration using simulated project data. No employer, client or commercially confidential information is used.
Project Profitability Dashboard
A Power BI dashboard concept designed to track project revenue, cost, margin, variance, and profitability movement across multiple projects.
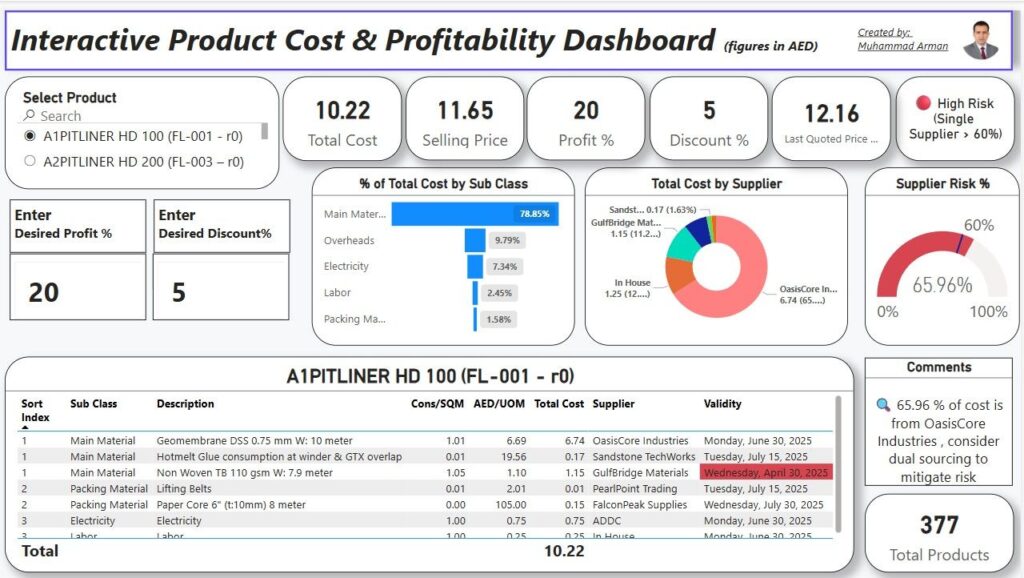
Sample product cost and profitability dashboard created with dummy data.
Focus areas:
- Project-wise revenue and cost visibility
- Gross margin movement
- Top profitable and loss-making projects
- Revenue and cost variance analysis
- Management-level summary view
Cost Control / EVM Dashboard
A cost control dashboard concept designed for project-based businesses to monitor planned value, earned value, actual cost, CPI, SPI, and cost overrun indicators.
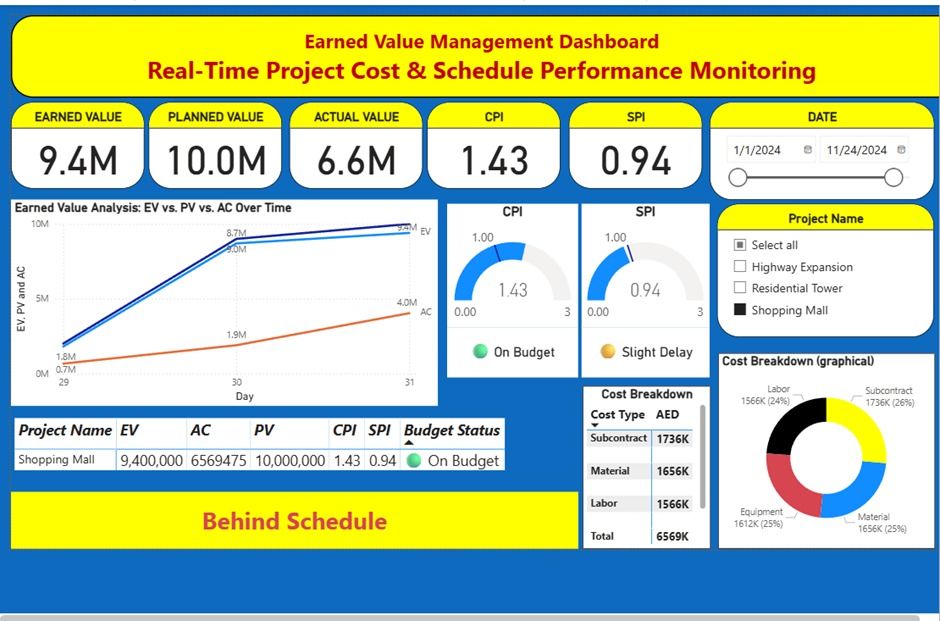
Sample EVM and project cost control dashboard created with dummy data.
Focus areas:
- Budget versus actual cost tracking
- CPI and SPI performance indicators
- Cost overrun visibility
- Material, labor, subcontractor, and equipment cost review
- Early warning indicators for management
MIS Automation Workflow
A monthly reporting workflow concept designed to convert manual Excel files and ERP exports into structured management reports with faster review, fewer manual errors, and clearer reporting controls.
ERP Export / Excel Files → Data Cleanup → Power Query / Power BI Model → MIS Dashboard → Management Summary
This workflow shows how manual monthly reporting can be converted into a structured MIS process where ERP exports and Excel files are cleaned, transformed, and converted into dashboards and management summaries.
Focus areas:
- Excel and ERP export cleanup
- Monthly MIS report structure
- Automated data transformation workflow
- Management summary and variance commentary
- Reduced manual preparation time